From address
to night margin.
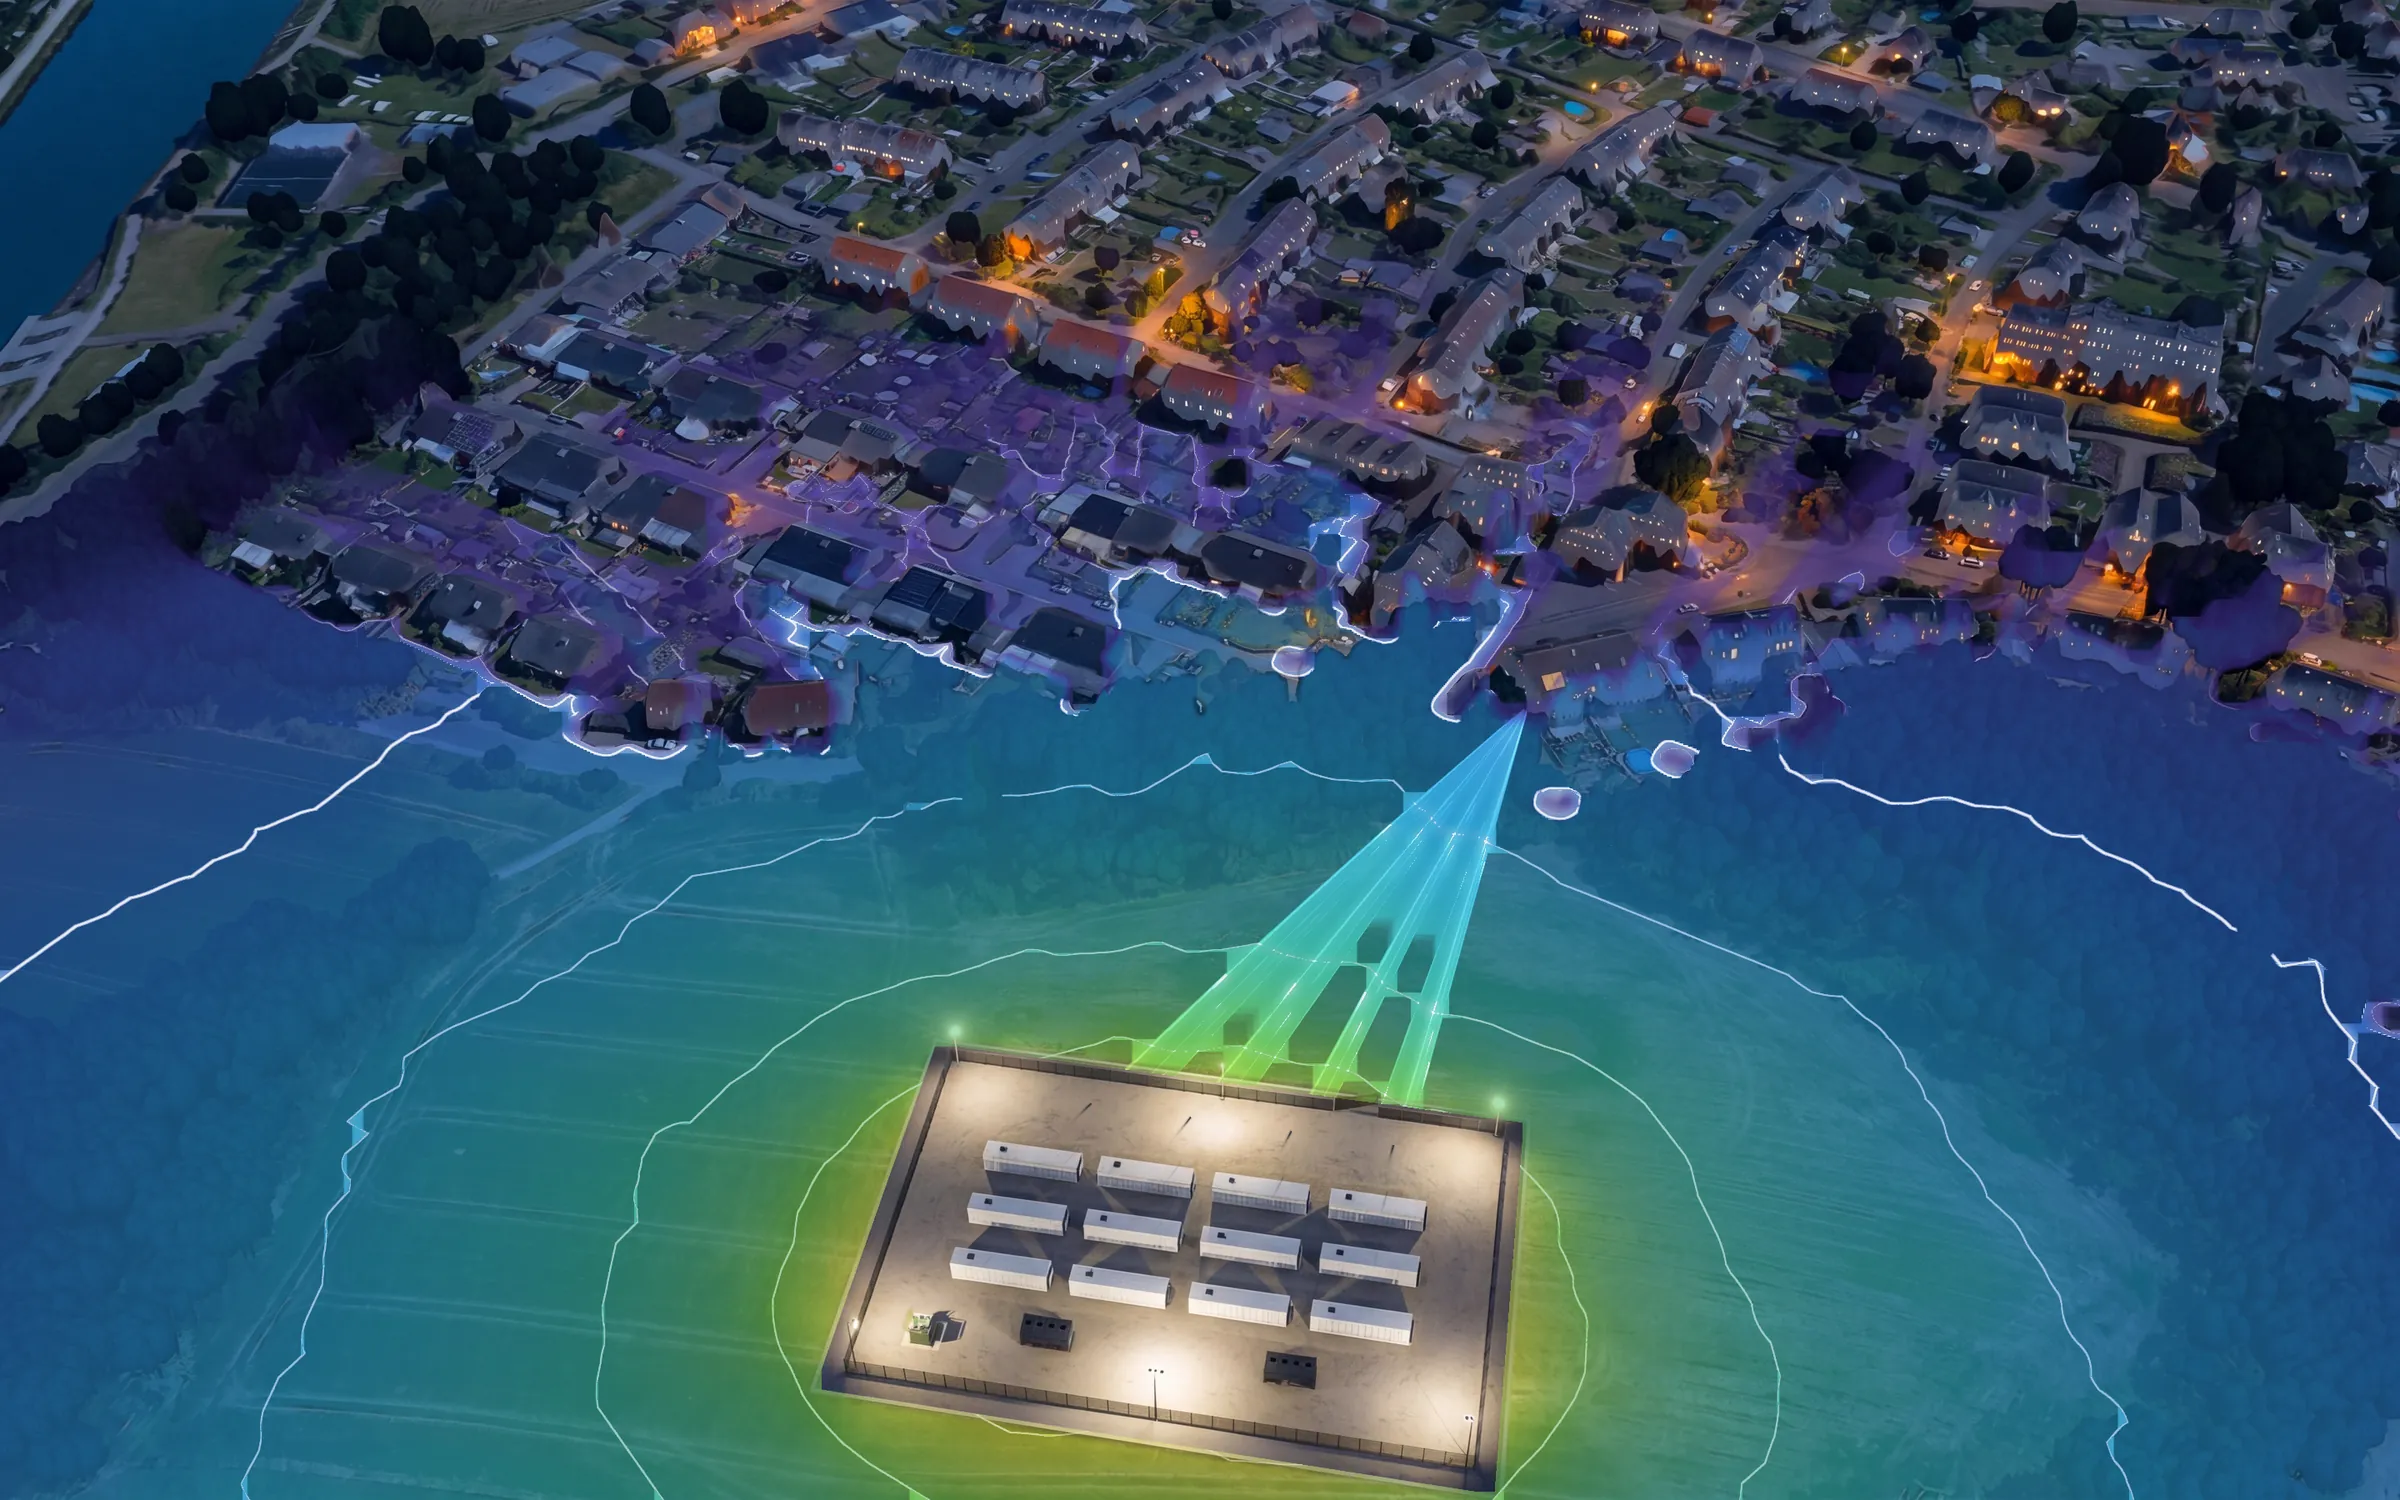
The five steps of the noise studio: the address opens on the real aerial in 3D, the battery yard is placed at true size, receptors are dropped at the nearest homes, the engine runs across nine bands. The level and the margin at every home — with the method and its uncertainty next to it.
Type the address. The studio opens on the aerial.
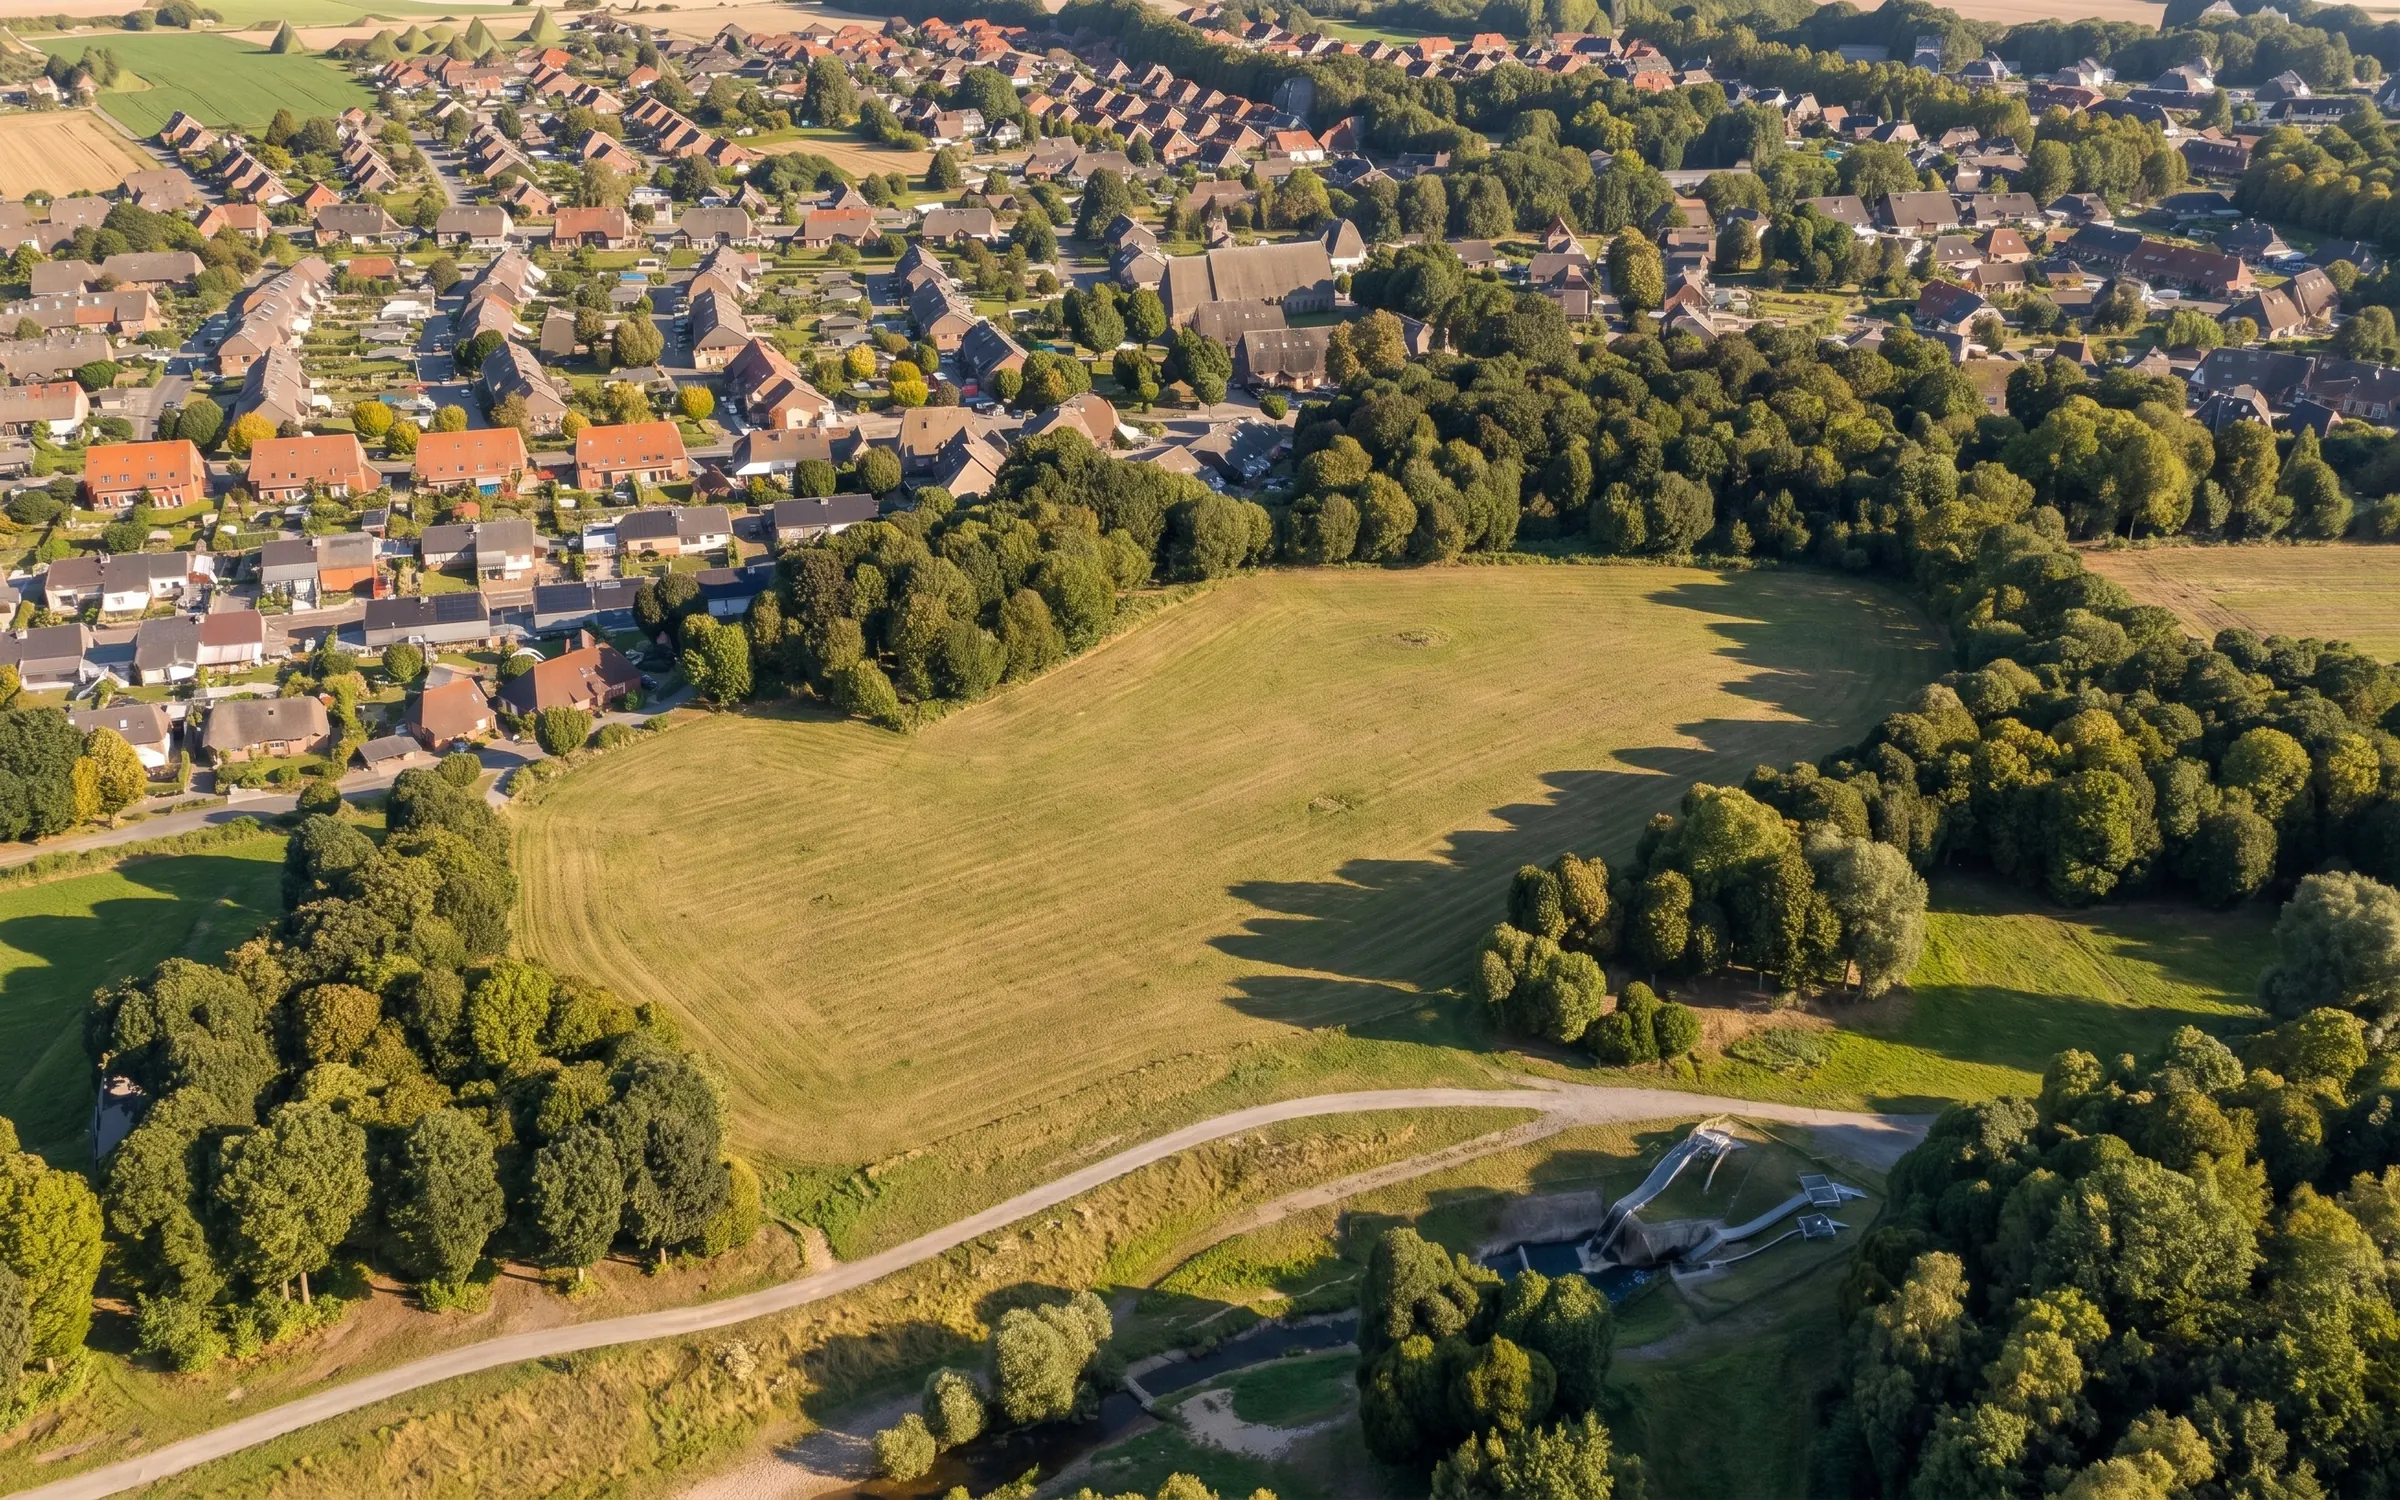
Type an address and the studio opens on the aerial photo at that point, with the surrounding buildings and trees in 3D. Everything after this step is built on that site.
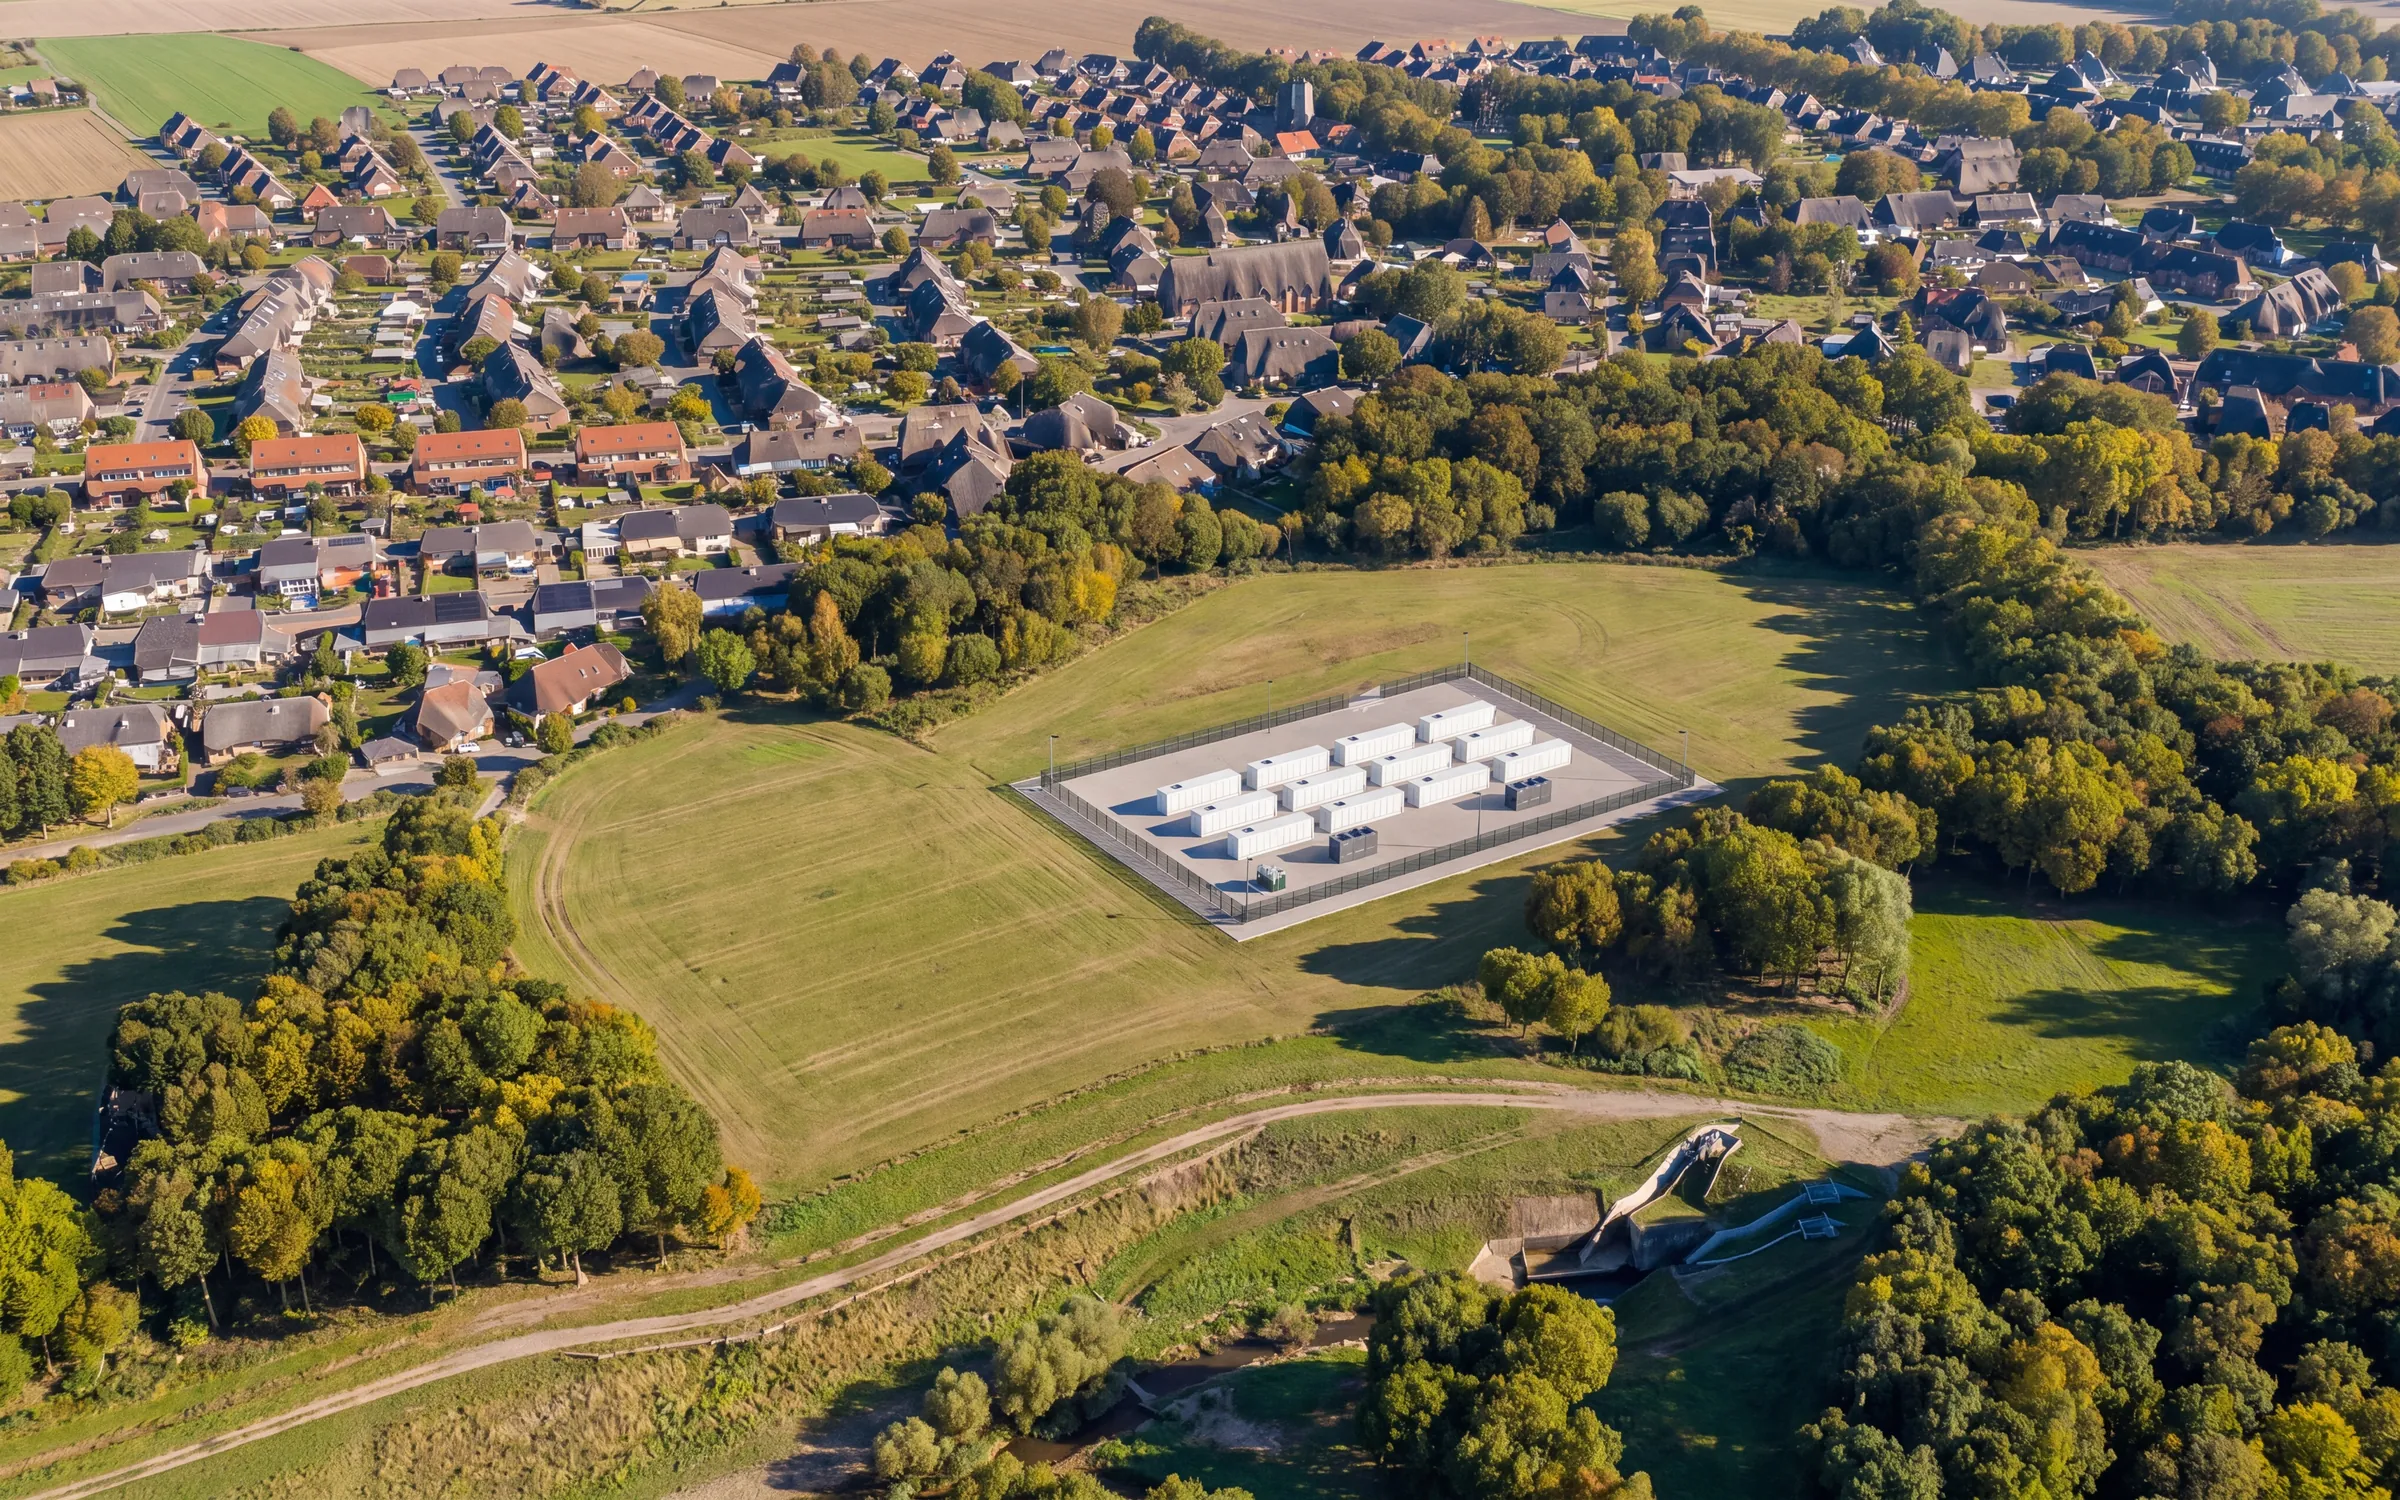
- 1One address, one site.
The studio centres the project on the address and opens the aerial photo there.
- 2The real site in 3D.
The aerial photo on the ground, the surrounding buildings and trees in 3D, the terrain under them.
- 3Saved on this device.
Projects stay in the browser you work in; the studio's map and data keys stay on the server.
Confirm what the engine sees.
Eight layers cover the site: the aerial on the ground, the elevation around it, the buildings and trees in 3D, the noise field after a run, the isolines, the rays to the worst-hit home, the receptors. Each one is on or off. Each one tells the engine which path the sound takes.
A yard at true size, six tools, three views.
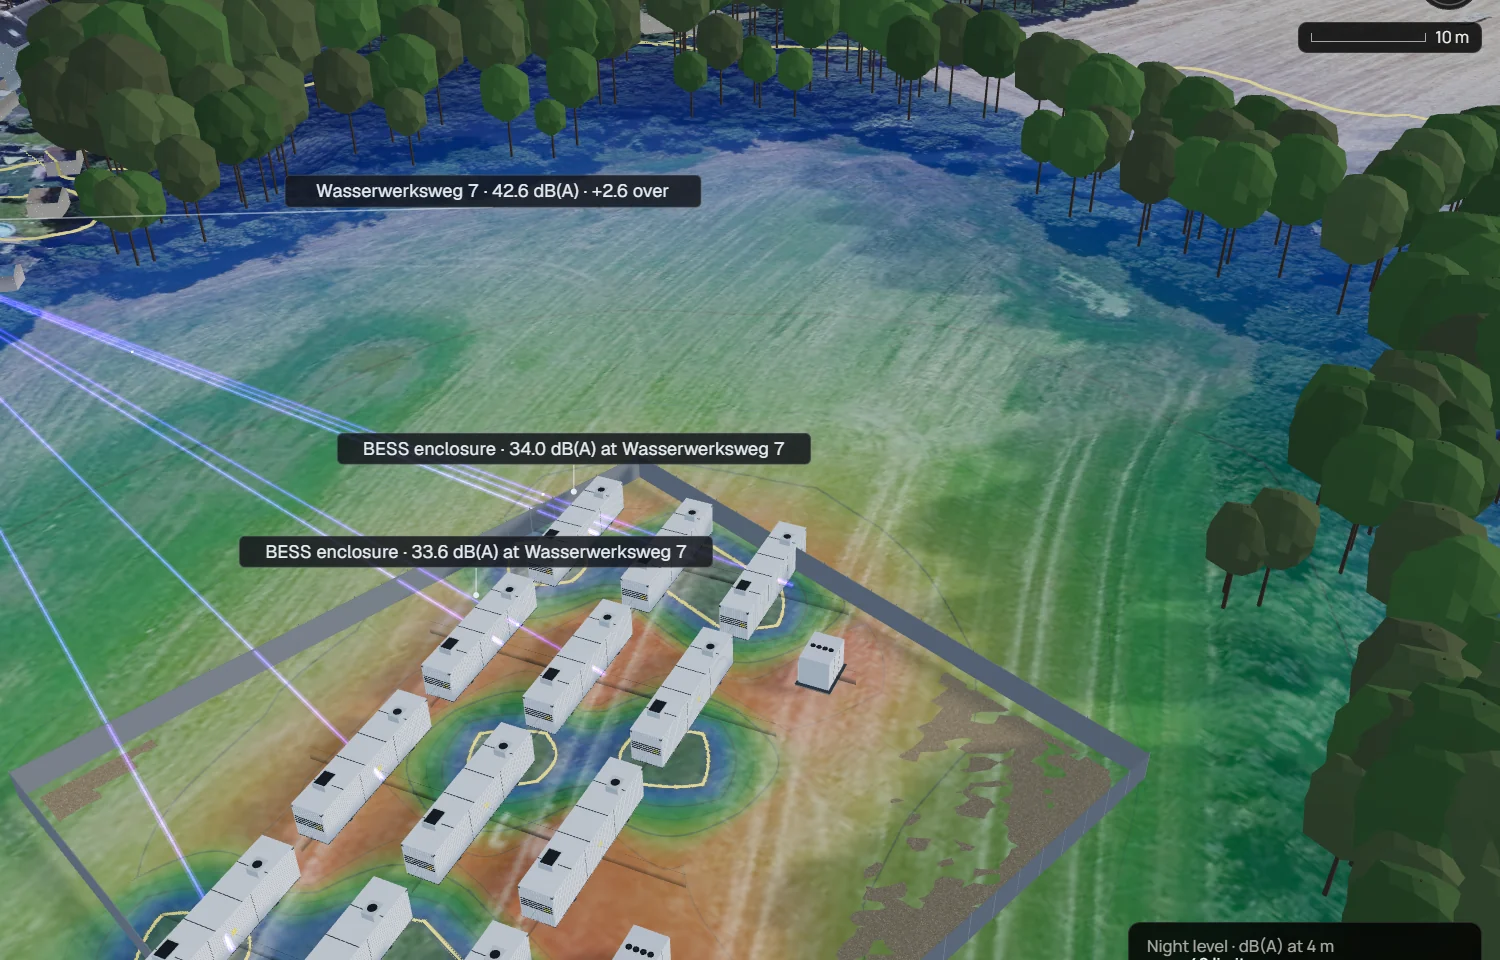
Twelve 40-ft enclosures sit on a gravel pad inside the fence, two PCS skids sit along one long side and the transformer at one end, the whole yard turned to follow the field. Six tools shape the model; three views frame it for the conversation at hand.
Six tools, one toolbar.
Move, Rotate and Measure write into the model. Receptor and Barrier become part of the calculation. Select is the home tool.
A receptor at each home, a spectrum and a contribution list at each receptor.
The studio reads each receptor two ways: the A-weighted octave spectrum across the nine bands the engine uses, and the per-unit contribution list sorted loudest first. The energetic total is written, not guessed.
Where the level at the apartment block comes from.
Each unit's contribution at the selected receptor, in dB(A). The energetic total is written underneath: 10·log₁₀ of the sum of 10^(L/10).
Why it matters · the rays in the studio carry exactly these numbers, one ray per unit to the worst-hit home.
A level at each home, a margin, an uncertainty.
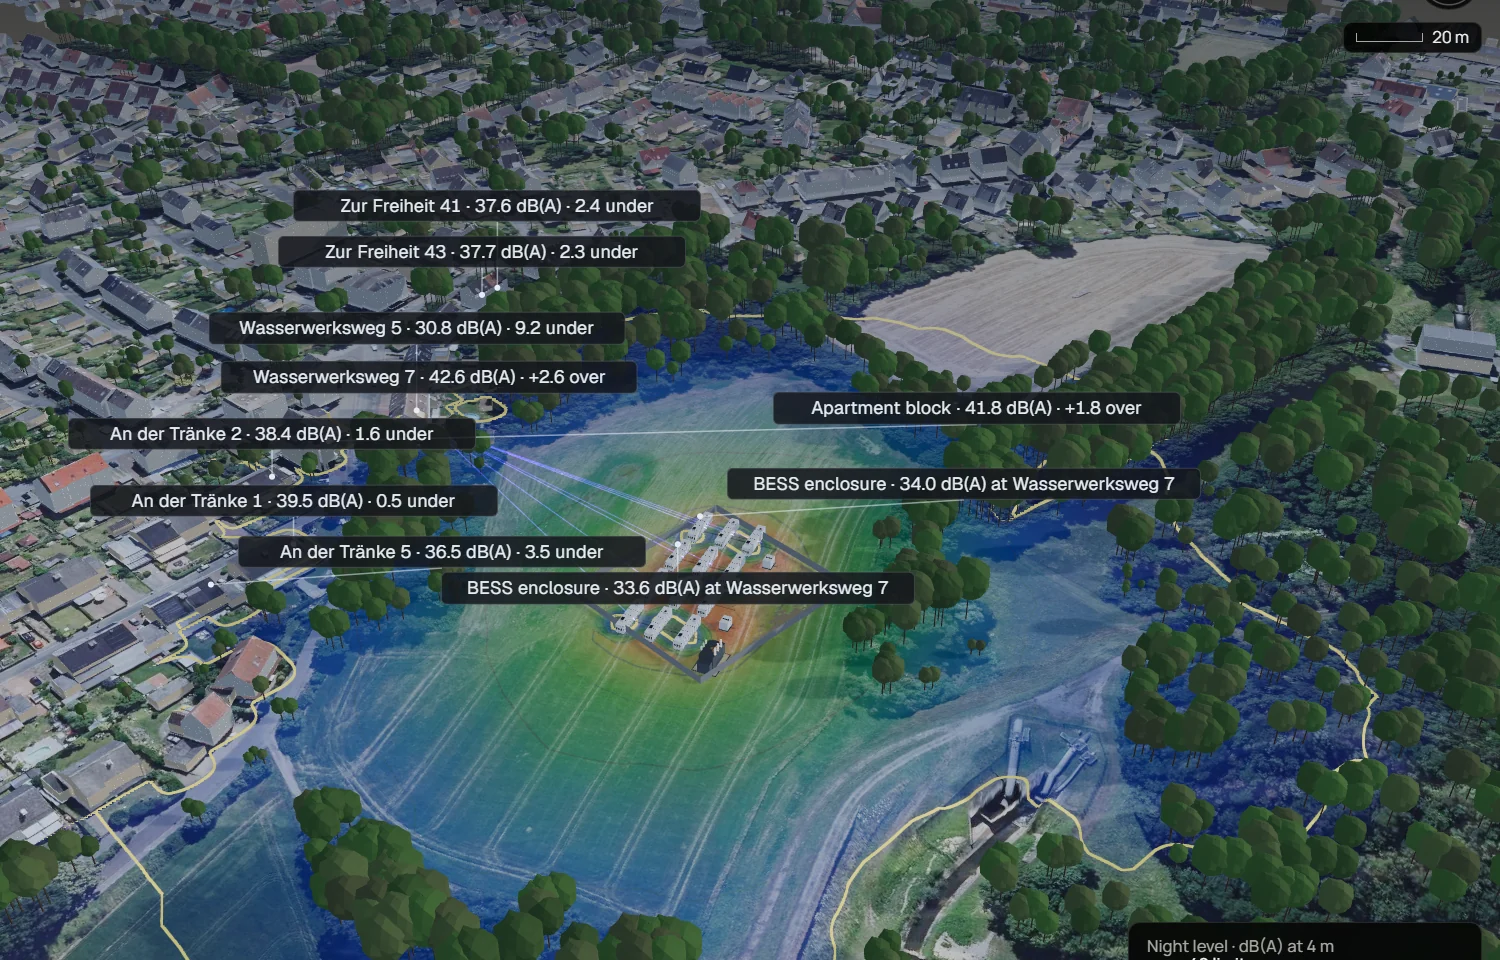
After a run the studio writes a level at every receptor. With it: the margin against the local night limit, and the ±3 dB that ISO 9613-2 states as its own accuracy, drawn around each level. A single headline number would call four of the eight homes that meet it fine. The studio puts the margin next to the band.
Two homes exceed the night limit: Wasserwerksweg 7 by 2.6 dB and the apartment block by 1.8 dB. Six meet it, by 0.5 to 9.2 dB; at the upper estimate the studio prints beside each level (P90), seven of eight are over. Every unit runs on the generic library entry: source data assumed, no manufacturer measurement. An der Tränke 1 is the nearest home at 114 m and reads 3.1 dB below Wasserwerksweg 7 — distance, screening and which face points where all count.
A margin is only as good as the uncertainty under it. Four of the eight homes that meet the 40 dB(A) night limit do so by 2.4 dB or less, while the method's own stated accuracy is ±3 dB. dBCAD shows the margin next to the band; a single headline number would call them fine.
A number sits on a class.
Every unit in the model carries an uncertainty class. Class A is the tightest. Class U is the library default plus 3 dB — labelled. The model writes the class into the report and propagates it into the engine's stated ±3 dB.
- Enclosures
- modelled as faces (area sources)
- PCS skids
- point with octave spectrum
- MV transformer
- point, library default
- Default class
- U · labelled in the run
| Class | What the data is | Uncertainty |
|---|---|---|
| A | Sound power per face, measured per octave band. The best available data; the engine uses the face geometry. | ±1.5 dB |
| B | Octave-band sound power for the unit, single value across faces. | ±2.5 dB |
| C | One dB(A) figure at a stated distance. Engine reverses it to sound power with broad assumptions. | ±4 dB |
| U | Nothing usable. The library default plus 3 dB, labelled in the report. | +3 dB, labelled |
A PDF the developer can hand to the acoustician.
The studio prints an eleven-page report with the same evidence it shows on screen, laid out on A4 and saved as a PDF. The page markers below are the report the studio printed for this example.
- 01CoverSite, coordinates, rule, period, date and the headline level against the limit.p 1
- 02SummaryThe worst home, its level, its difference to the limit and the P90 upper estimate; every home in one table.p 2
- 03Site plan and noise mapThe yard from above with the night field, the paths to the homes and a north arrow.p 3
- 04The site in 3DA perspective view of the same model, the field draped on ground and roofs.p 4
- 05ReceptorsEach home: its A-weighted octave spectrum and the units that set its level, loudest first.p 5–6
- 06Sound sourcesEvery unit type with its count, its sound power, its data class and the basis for each value.p 7
- 07Regulatory basisThe instrument and clauses, the periods, the limits by zone and the surcharges, with references.p 8
- 08MethodThe equations of ISO 9613-2 as applied, term by term, with the assumptions behind each.p 9
- 09Data sources and assumptionsEvery input and its origin, and the assumptions the result rests on.p 10
- 10AppendixThe input data: every unit and every receptor with its coordinates, height and rotation.p 11
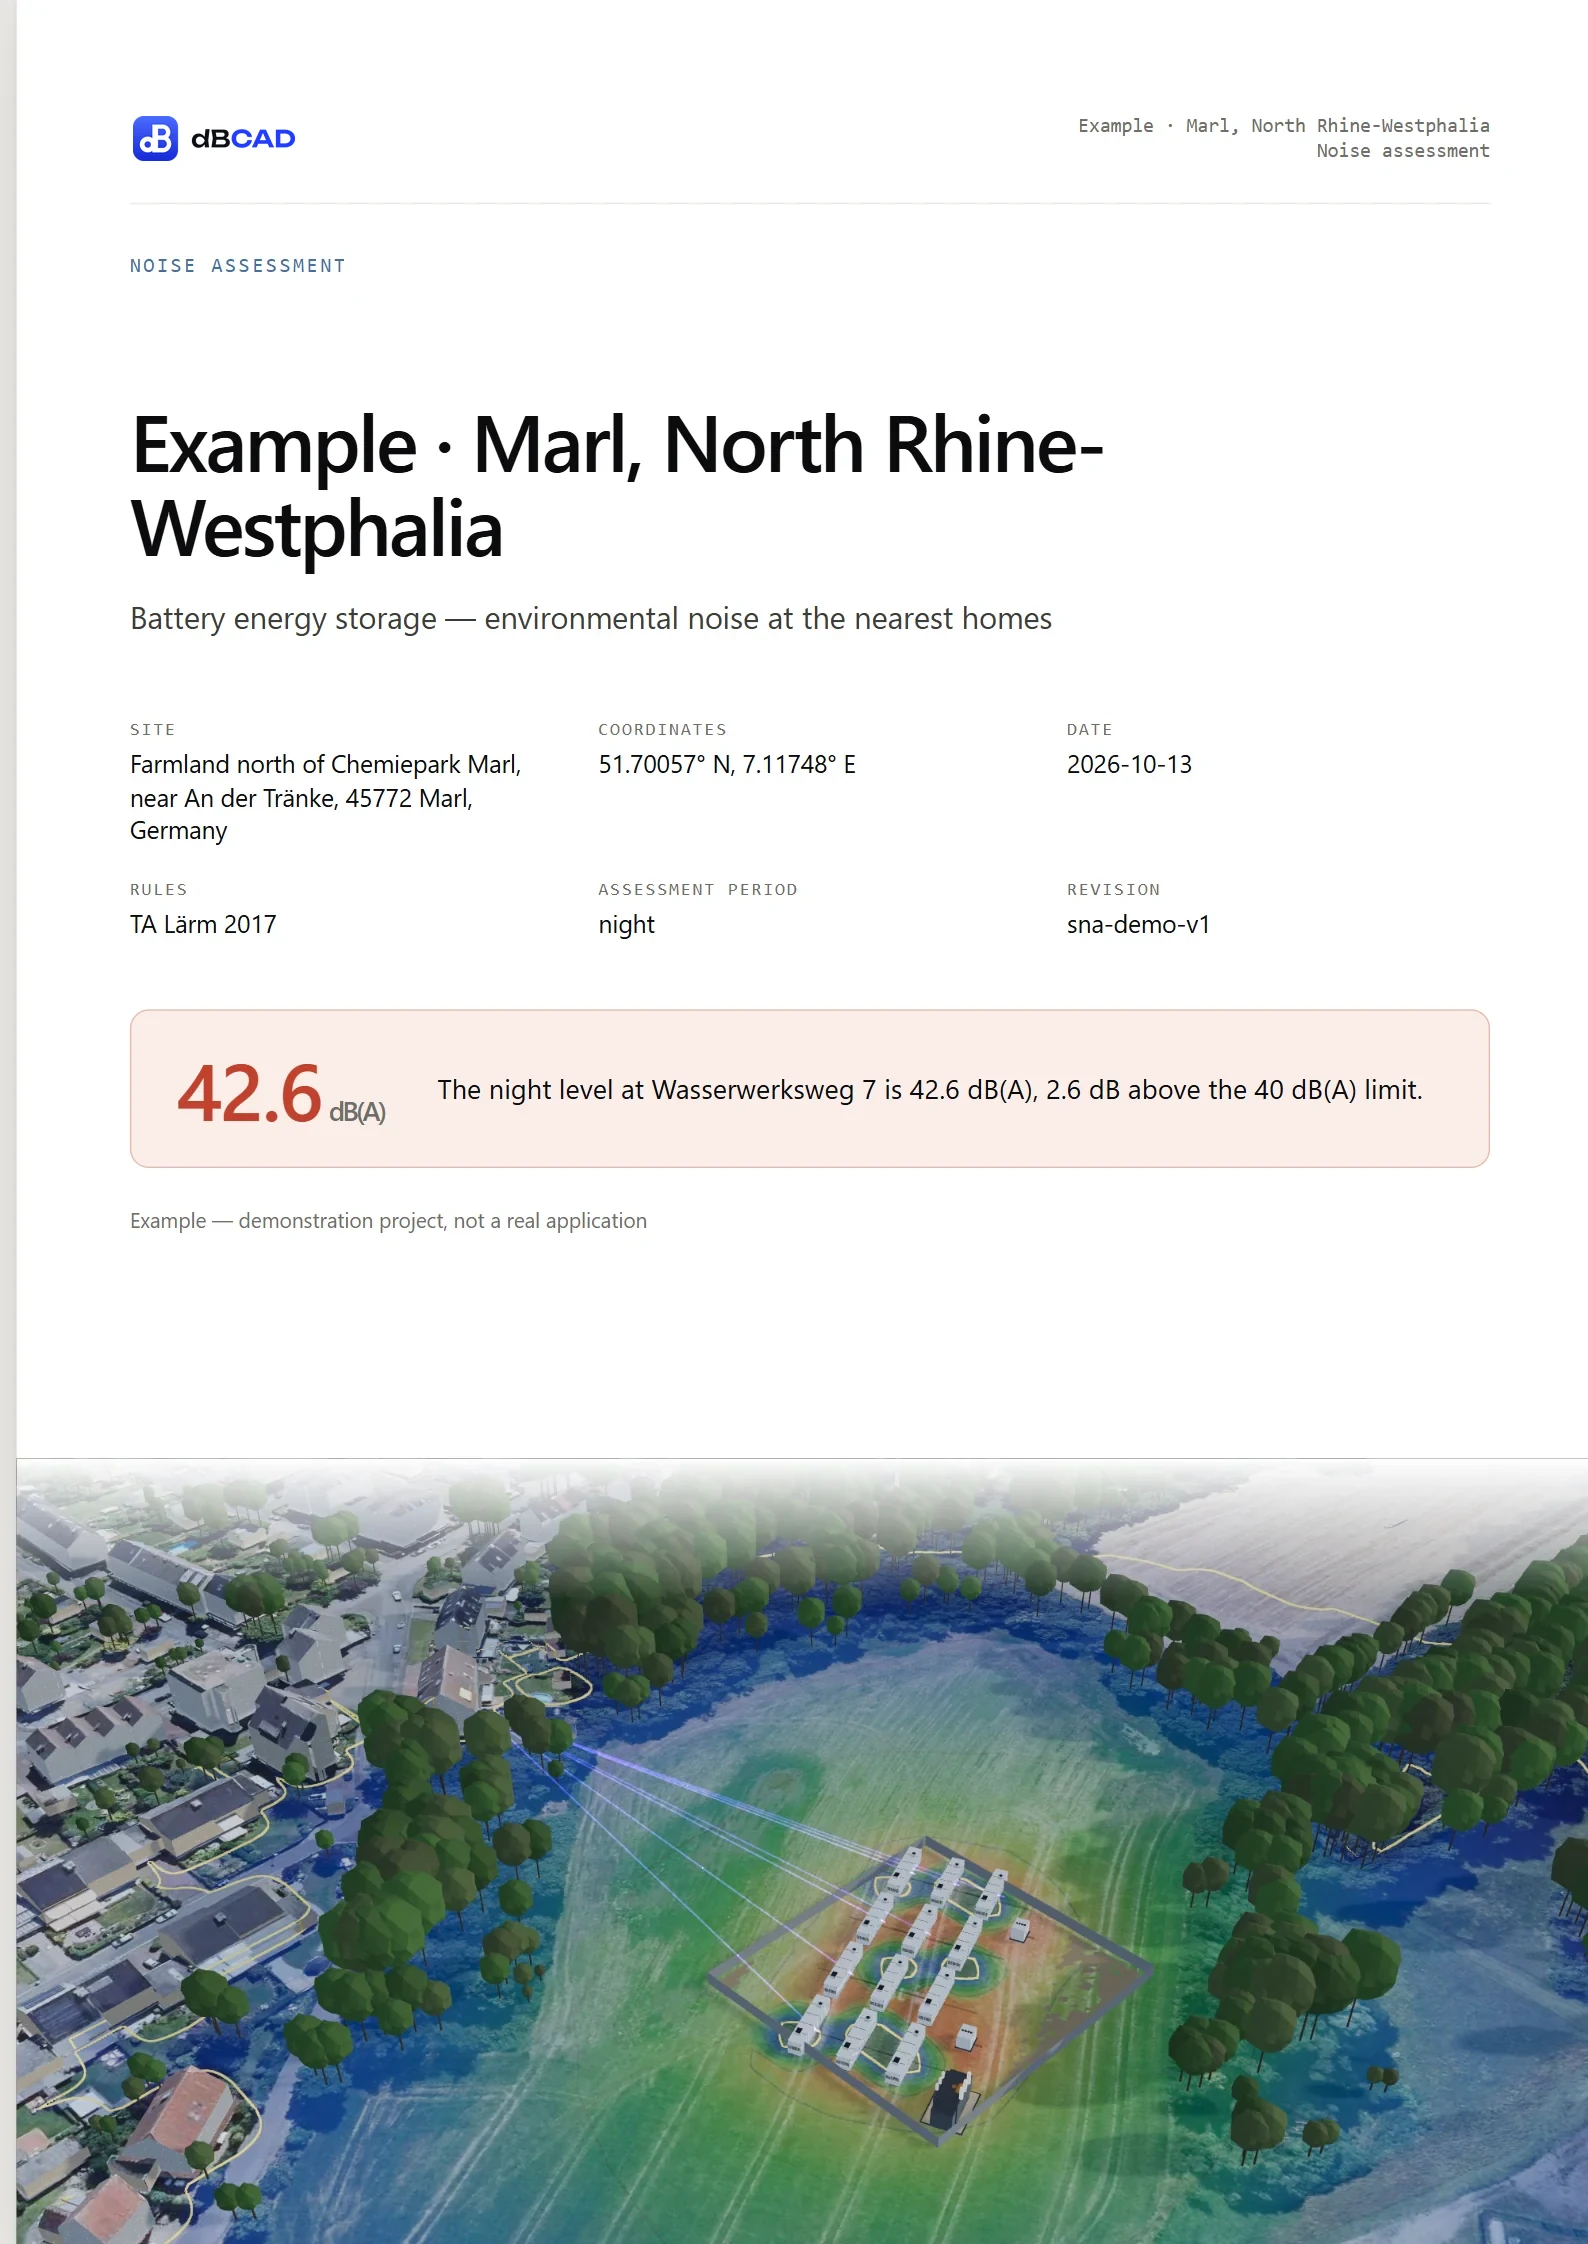
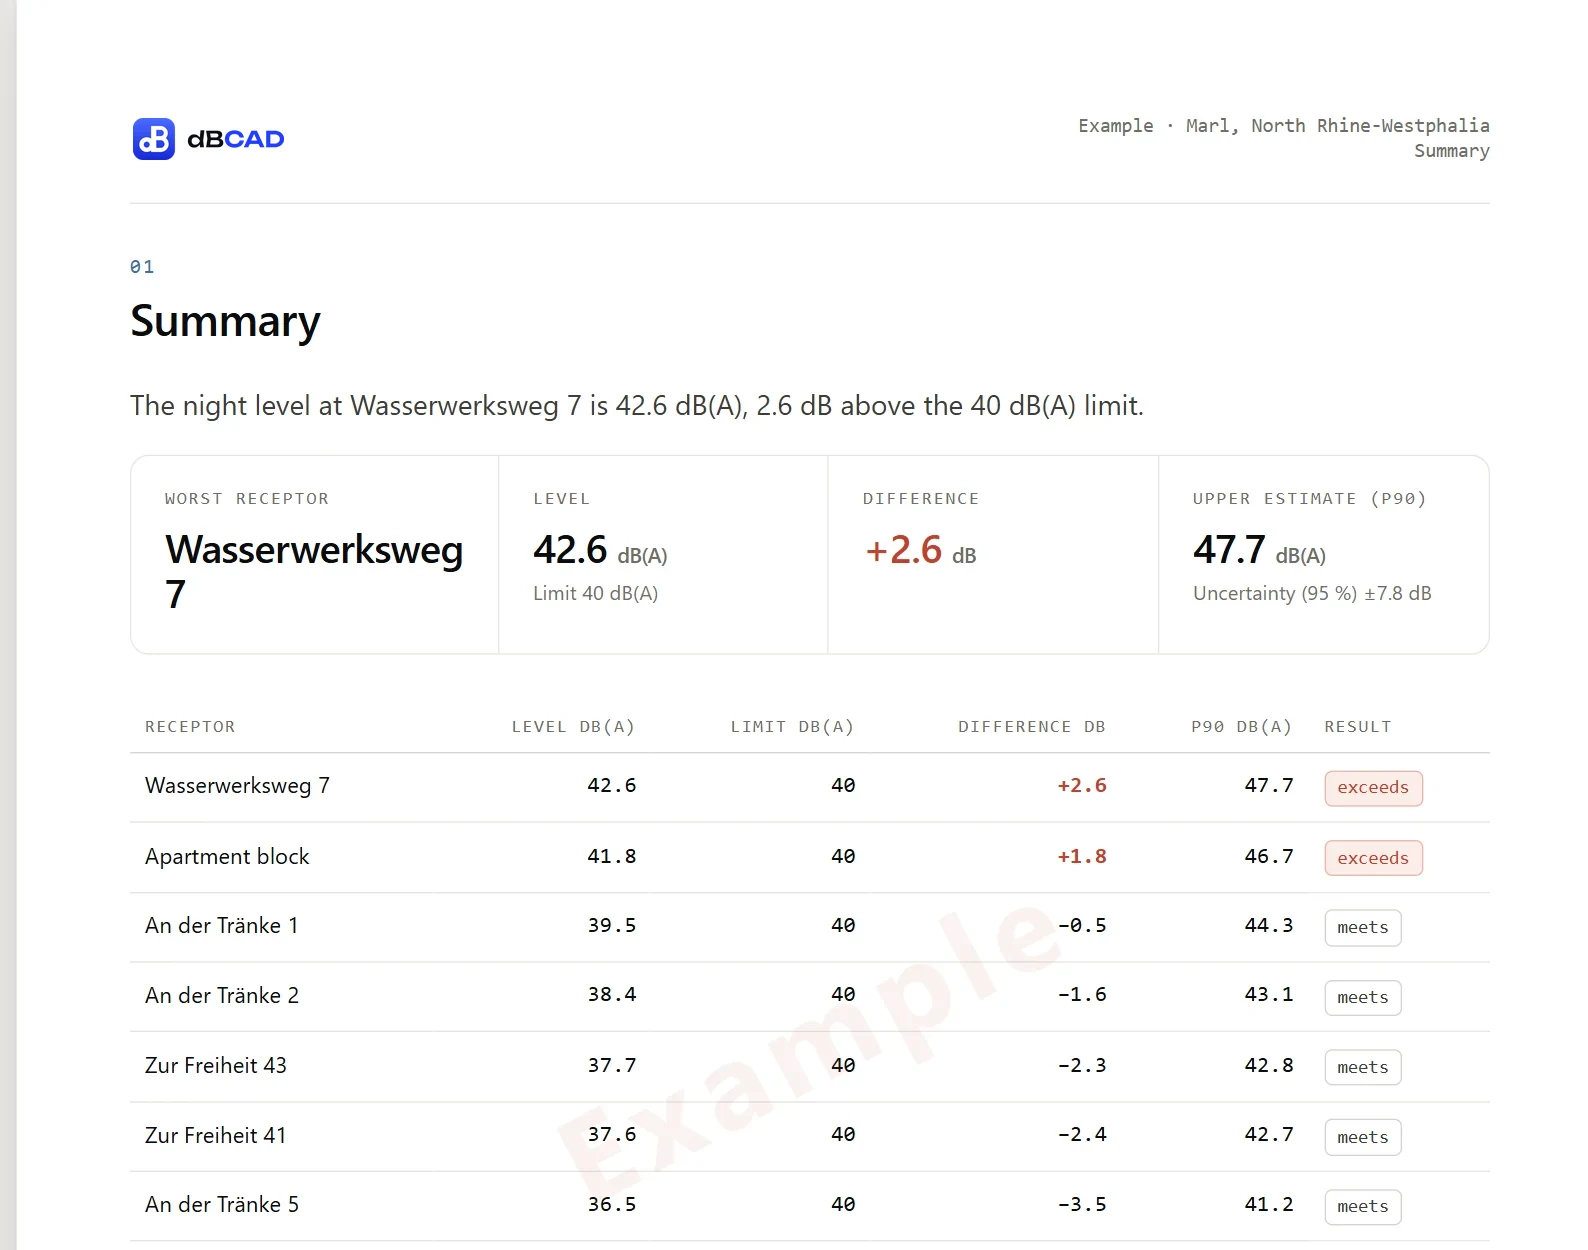
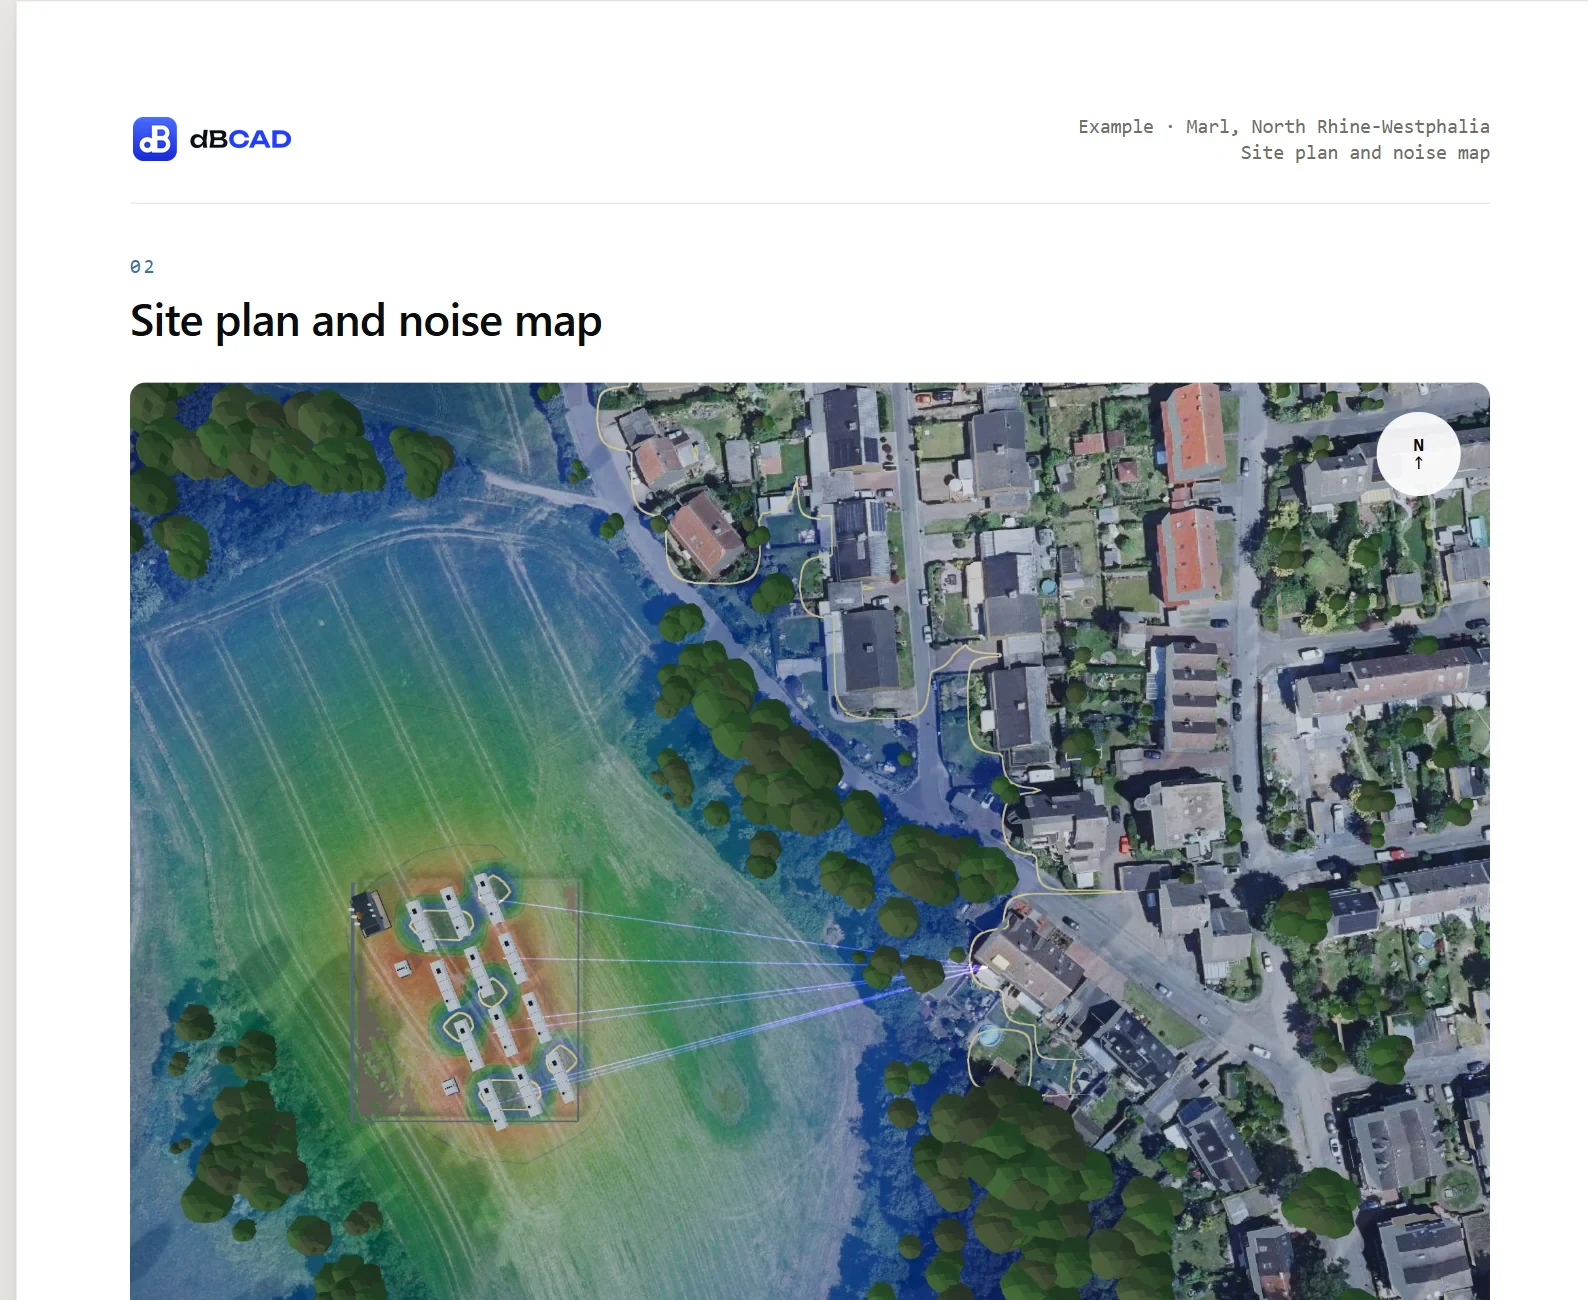
Pages from the report the studio printed for this example (sixteen pages in all) · Example · Marl, North Rhine-Westphalia
Full specification · instrument datasheet eight columns · bands · method · periods · receptors · field · views · sources · stages · report
Engine
- Method
- ISO 9613-2
- Per-band path
- 31.5 Hz → 8 kHz
- Bands
- 9 octave
- A-weighting
- at the receptor
- Air absorption
- ISO 9613-1 · T, RH, p
- Ground effect
- per band · G alternates
- Screening
- buildings, trees, barriers
- Run points
- per receptor · 4 m grid
- Stated accuracy
- ±3 dB
Periods
- Day
- 06:00 – 22:00
- Evening
- varies by rule
- Night (binding)
- 22:00 – 06:00
- Limits per rule
- jurisdiction table
- Launch countries
- DE · NL · FR · BE-FL · ES
- Rule flag
- "unverified" until reviewed
Receptor
- Height · DE
- facade · 4.0 m · 0.5 m out
- Height · NL
- facade · 5.0 m
- Height · FR
- boundary · 1.5 m
- Height · BE-FL
- facade · 4.0 m
- Height · ES
- facade · 4.0 m
- Basis
- facade or outdoor · stated
Field
- Range
- 30 → 75 dB(A)
- Steps
- 5 dB(A)
- Isolines
- 5 dB(A) rings
- Grid
- 4 m · uint8 base64
- Surface
- ground · roofs · trees
- Aerial
- shows through
Views
- Field
- plan view · field + isolines
- Field + 3D
- field with 3D buildings
- 3D twin
- camera frames ray paths
- Switcher
- three tabs · keyboard
Source classes
- A · per face
- ±1.5 dB
- B · per band
- ±2.5 dB
- C · at distance
- ±4 dB
- U · default
- +3 dB · labelled
- Large enclosures
- modelled as faces
Stages
- 01 Address
- real coordinates
- 02 Confirm site
- eight layers
- 03 Place units
- true size on pad
- 04 Receptors
- drop at homes
- 05 Run
- engine · 9 bands
Report
- Cover
- site · period · rule
- Site plan
- yard · receptors
- Sources
- unit · class · basis
- Receptors
- LAeq · margin · basis
- Compliance
- all periods
- Contours
- field + limit line
- Method
- ISO 9613-2 terms
- Data sources
- every input cited
Limits, stated once. The example zone (WA) is assumed and not verified against the local plan. The transformer carries class U and is labelled in the report. The night run is the binding case; day and evening are not stated above. The full method and limits live on Science
See the night before you file.
Place the battery yard on your real site, run the engine, read the margin at every home next to the band. Request access to walk the example and pin your own coordinates.